Case study · Airbnb listing optimization
From being found to getting booked: 13 luxury Hocking Hills listings
Published November 2026
We optimized 13 high-amenity vacation rentals in Hocking Hills, Ohio for Airbnb search. Airbnb's own data shows first-page visibility rising from 32% to 57.8%, search click-through rising from 6.14% to 8.19% and listing-to-booking conversion rising from 0.33% to 1.33%, about four times higher.
At a glance
- Client
- Luxury vacation rental operator (name kept private)
- Market
- Hocking Hills, Ohio
- Portfolio
- 13 luxury listings
- Service
- Airbnb listing optimization
- Data
- Airbnb host dashboard, Nov 21, 2025 to Apr 21, 2026
The performance shift
- listing-to-booking conversion.Reported change: 0.33% to 1.33%.
- 4×
- first-page visibility.32% to 57.8%.
- +25.8 points
- relative search click-through growth.6.14% to 8.19%.
- +33.4%
- page views compared with similar listings nearby.
- +57,767
- page views compared with the previous 151 days.
- +14,065
Observed results from Airbnb reports. The measured improvements are not a controlled attribution study.
What was the opportunity?
Premium homes. A more competitive search journey.
Lodging Gurus reviewed how 13 high-amenity vacation rentals appeared in Airbnb search, how guests engaged with listing previews and how those visitors moved toward a booking. The goal: make each property easier to discover, easier to evaluate and easier to book.
Why this matters to property owners
More exposure alone is not the win. The value is a connected guest journey: a stronger search presence, a more compelling listing and better conversion when guests reach the property page.
What did we change?
A system, not a cosmetic refresh.
Each improvement addressed a measurable step in the guest's decision, with portfolio-wide standards applied to the strengths of each property.
- 01Discover
- 02Click
- 03Evaluate
- 04Book
01Search discoverability
We audited amenities, property data, calendar settings and search relevance against comparable large-group stays.
02Search-result appeal
We focused titles, cover-photo priorities and premium amenities on the reasons guests click.
03Listing page conversion
We improved photo order, descriptions and sleeping and room details to make each stay easier to assess.
04Booking friction
We reviewed pricing, minimum stays, discounts and inquiry handling to find what was stopping bookings.
05Revenue readiness and demand alignment
We built demand-aware pricing and competitive context into optimization decisions. Financial return is the next measurement, and this case study does not claim a verified revenue increase.
How did we measure the results?
| Funnel stage | What Airbnb measures | Before | After | Change |
|---|---|---|---|---|
| Discoverability | First-page search impression rate | 32% | 57.8% | +25.8 points |
| Engagement | Search-to-listing conversion (click-through) | 6.14% | 8.19% | +33.4% relative |
| Conversion | Listing-to-booking conversion | 0.33% | 1.33% | about 4× |
Five operating levers. Three measured funnel stages. One guest journey.
The results in Airbnb's own data
A measurable competitive advantage.
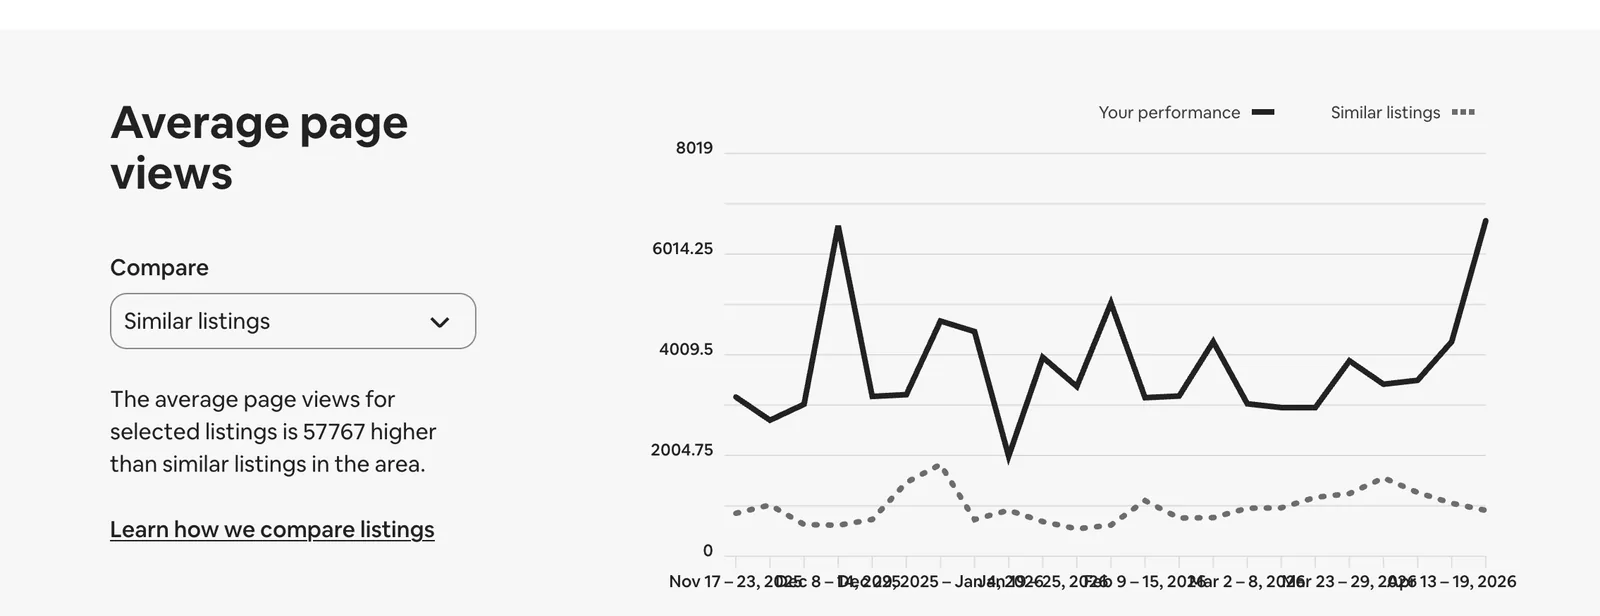
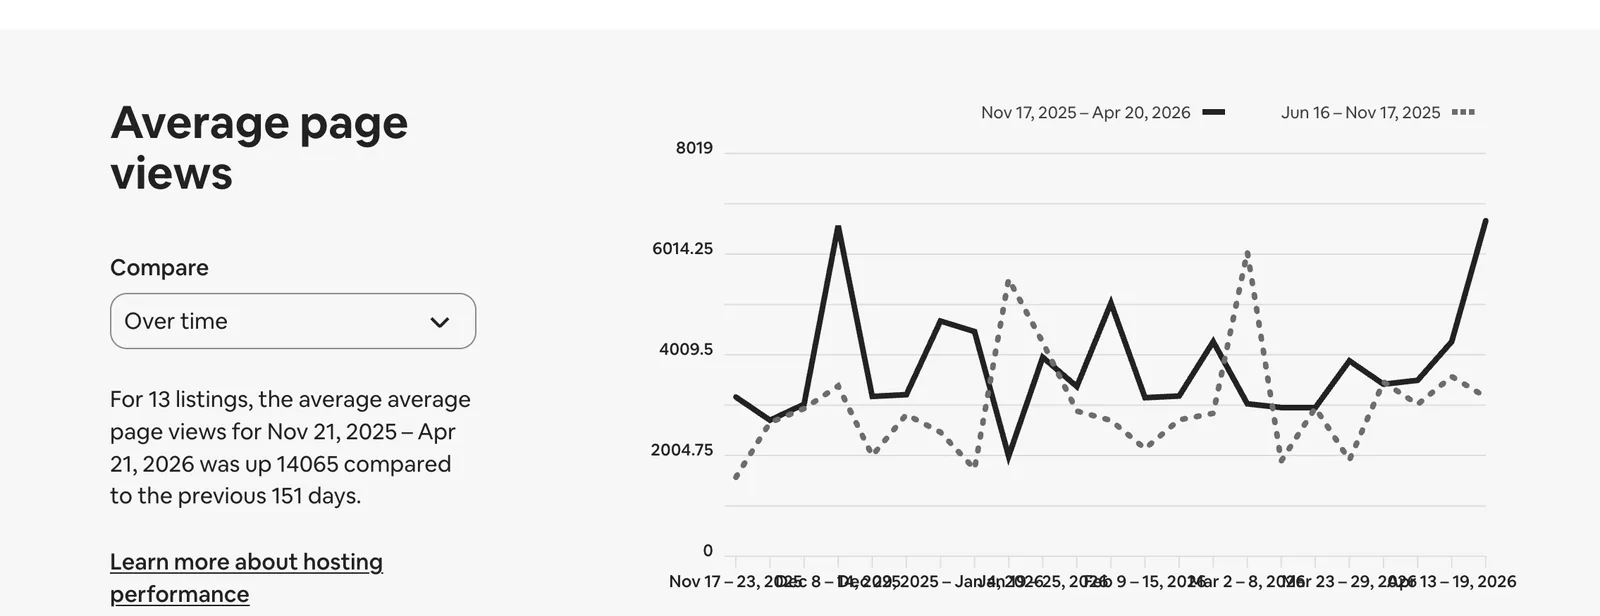
Two original Airbnb dashboard views give independent context for traffic. The conversion change is reported separately from these screenshots.
+57,767 page views compared with similar listings · +14,065 page views compared with the previous 151 days
 Opens the full-size image in a new tab
 Opens the full-size image in a new tab
Data definitions and credibility note
Source: Airbnb host dashboard for 13 listings, Nov 21, 2025 to Apr 21, 2026. Airbnb shows 6,181 average page views and 75,461 average first-page impressions for the portfolio. The +57,767 and +14,065 figures are Airbnb's comparison differences, not portfolio totals. The conversion figures come from Airbnb's conversion report for the same portfolio. Comparisons on their own do not prove cause.
Frequently asked questions
It is the share of a listing's search impressions that appeared on the first page of Airbnb search results. For this portfolio it rose from 32% to 57.8%, so the listings showed on page one far more often.
It is the share of guests who saw a listing in search results and then opened the listing page. It shows whether the title, cover photo and price in search are winning the click. Here it rose from 6.14% to 8.19%.
It is the share of guests who opened a listing page and then booked. It reflects photos, description, room details, price and booking rules. Here it rose from 0.33% to 1.33%, about four times higher.
Five things: search discoverability (amenities, property data, calendar settings), search-result appeal (titles, cover photos, featured amenities), listing page conversion (photo order, descriptions, room details), booking friction (pricing, minimum stays, discounts, inquiry handling) and demand-aware pricing.
This case study does not claim a verified revenue increase. It measures search visibility, clicks and conversion in Airbnb's own reports. Revenue is the next measurement.
Yes. Start with a free instant score of your listing, or see how our listing optimization service works.
Instant audit